
📈How to read options — a complete guide (calls, puts, Greeks, payoff)
📘 Educational, historical example — NOT a current signal, recommendation or order to trade. The specific numbers (entries, risk and target levels, success rate, holding period) are illustrative and refer to the past. Past results do not guarantee future ones. QMA is an analytical and educational tool, not investment advice.
Options sound complicated, but the core idea is simple: a contract that gives you the RIGHT (not the obligation) to buy or sell a stock at a set price by a set date. This guide takes you from the absolute basics to advanced strategies — with accurate charts and concrete worked examples on a $100 stock — so you can see exactly how options behave.
Important up front: Options are leveraged derivatives. They can expire worthless and lose 100% of the amount invested (some selling strategies can lose more). Real prices, spreads and fills differ from the illustrative examples. Past results do not guarantee future ones.
1. What a call and a put are
There are only two basic kinds of option:
- Call = the right to buy the stock at the strike price. Gains value when the stock rises.
- Put = the right to sell the stock at the strike. Gains value when the stock falls — which is why a put doubles as insurance.
2. Four terms you must know
| Term | What it means |
|---|---|
| Strike | The fixed price at which the option lets you buy (call) / sell (put). The line profit is measured from. |
| Expiration | The date the option ends. Then it either has value or expires worthless. |
| Premium | The option's price — what you pay (buyer) or collect (seller). |
| ITM / OTM | "In the money" already has intrinsic value; "out of the money" is still a pure bet on a move. |
3. The Greeks — made simple
You don't need to be a mathematician. Just understand what they measure:
- Delta (Δ) — how much the option price moves when the stock moves $1. Delta 0.5 ≈ the option moves $0.50. Also read as the rough probability of finishing in the money.
- Theta (Θ) — how much the option loses each day simply from time passing. 🧊 Like an ice cube — even if nothing happens, it slowly melts. The buyer's enemy, the seller's friend.
- Vega / IV — sensitivity to implied volatility (expected "nervousness"). High IV = expensive options (the market expects a big move, e.g. before earnings). IV tells you the expected range, not the direction.
4. How to read a payoff chart
Every strategy can be drawn as a profit-and-loss curve depending on where the stock ends. The horizontal axis = stock price, the vertical = your P/L. Green = you profit, red = you're in the red, the amber line = the break-even. This is the single most important skill in options trading — once you can read the shape of the curve, you see the risk at a glance.
5. Buying strategies — a bet with capped loss
Long Call
You buy a call and bet on a rise. Max loss = the premium paid. Upside is theoretically unlimited, but you must beat the strike and the premium.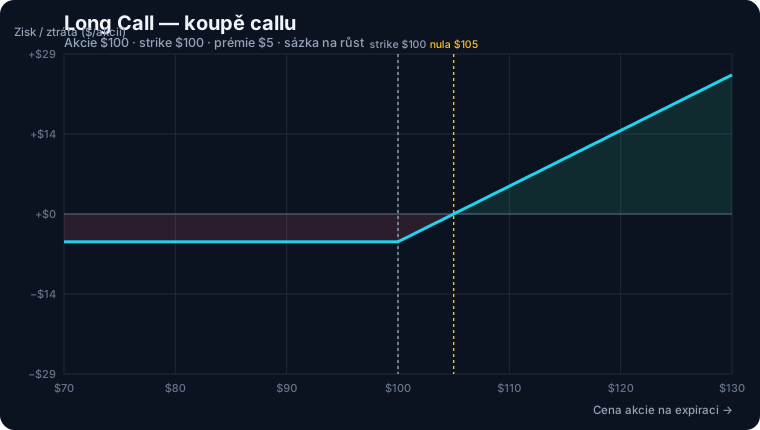
Example: Stock $100, buy a $100 call for $5. Below $100 the loss stays −$5. You break even only above $105. Above that you profit.
Long Put
The mirror image — a bet on a fall (or insurance). Max loss = the premium.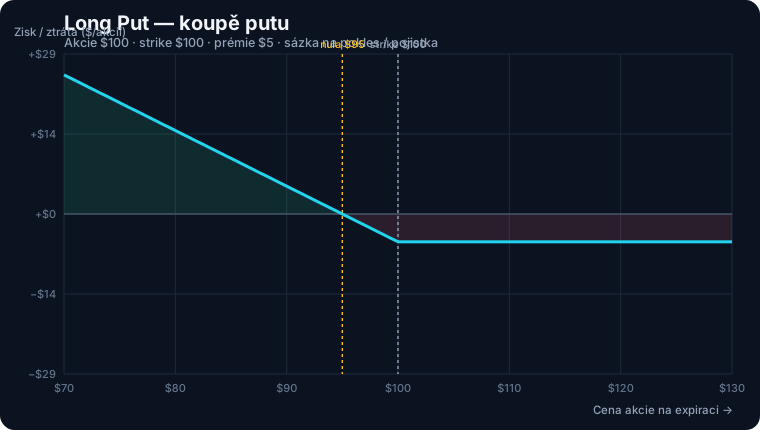
6. Time decay — why "hitting the strike" isn't enough
The most common beginner mistake: "the stock just has to reach my strike and I win." Not so fast. An option's value is intrinsic value plus time. The "today" curve sits above zero only thanks to the remaining time — which melts away every day (theta). Look at the gap between the "today" and "at expiry" curves:
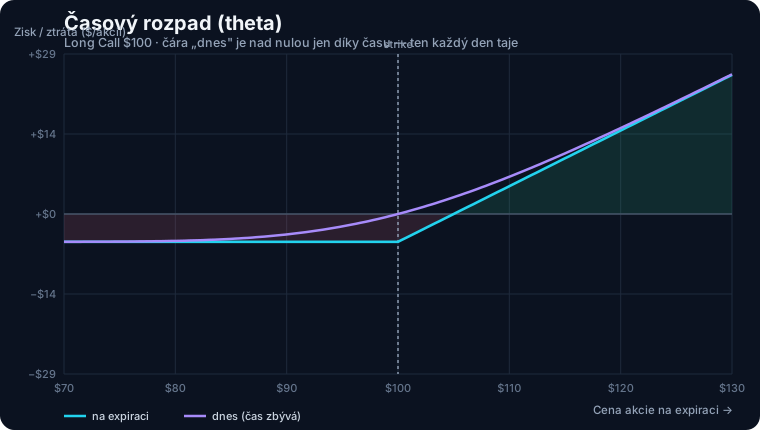
➤ This is why option buyers need the stock to move enough and in time. Option sellers, conversely, profit from time decay.
7. Income strategies — and the honest truth
Covered Call
You hold 100 shares and sell a call against them — collecting premium in exchange for a capped upside.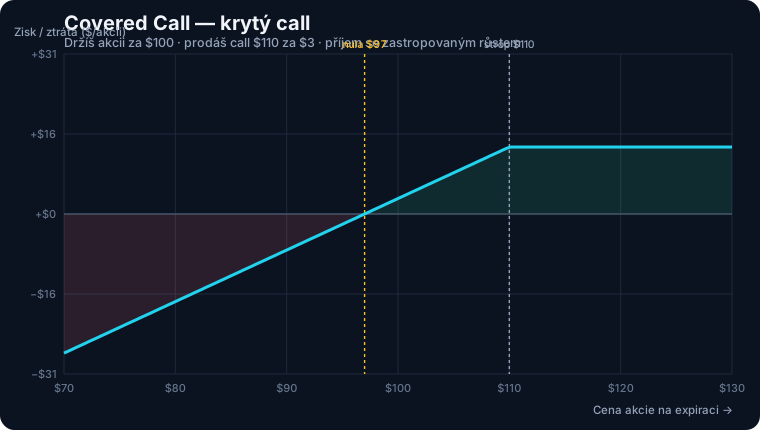
Example: Stock $100, sell a $110 call for $3. Above $110 you gain no more — the cap is $10 (rise) + $3 (premium) = $13. Down, the premium only cushions $3.
Cash-Secured Put
You sell a put and set aside cash to buy if assigned. High win rate, but you keep the full downside.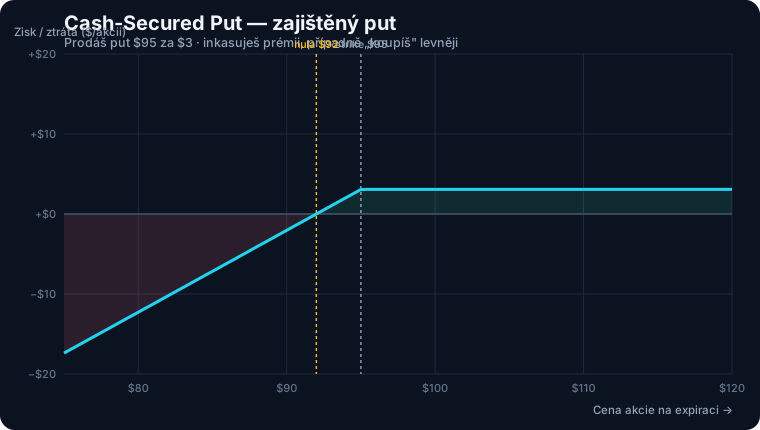
★ Myth vs. real. Many courses promise "safe monthly income that beats the index." 35+ years of data don't back it up. CBOE indices: the at-the-money covered call (BXM) returned only ≈ one-third of the S&P 500 over the last decade of strong rally; put-write (PUT) ≈ 10.1% vs S&P 9.8%/yr (1986–2015) — it leads in quiet and falling markets, lags when stocks surge. These strategies cap upside but keep downside: high win rate ≠ high return. They make sense as income-with-a-tradeoff and as hedging, not as a money machine.
8. Spreads — defined risk
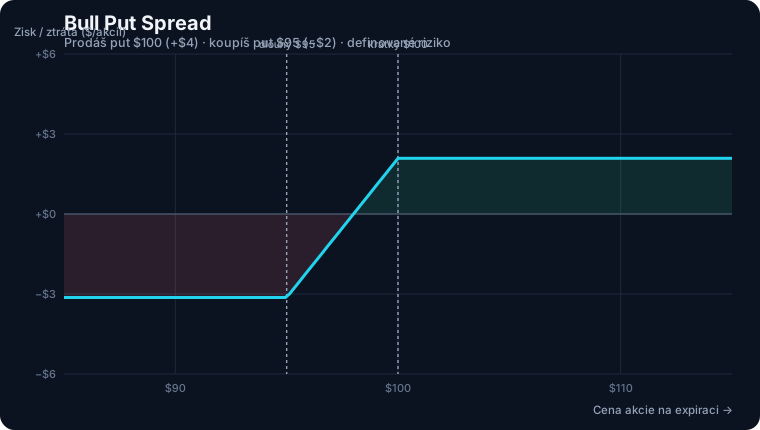
A spread = you sell one option and buy another as insurance. Max loss is therefore fixed in advance.
Bull Put Spread (mildly bullish)
Bear Call Spread (mildly bearish)
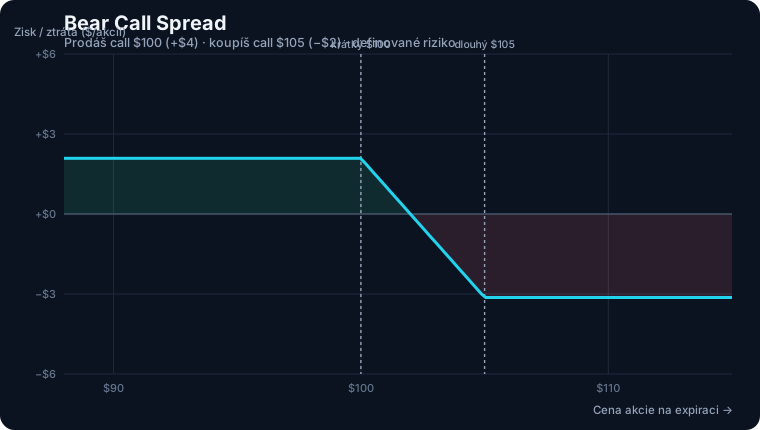
Note the ratio: on a $5-wide spread for $2 of premium you risk $3 to make $2 — a typically unfavourable risk/reward that a high win rate has to compensate for.
9. Hedging stock — the most legitimate use of options
If you already hold the stock and want to protect it against a drop, options are an excellent risk-management tool.
Protective Put
Insurance: below the strike you stop losing (apart from the premium). Your upside stays.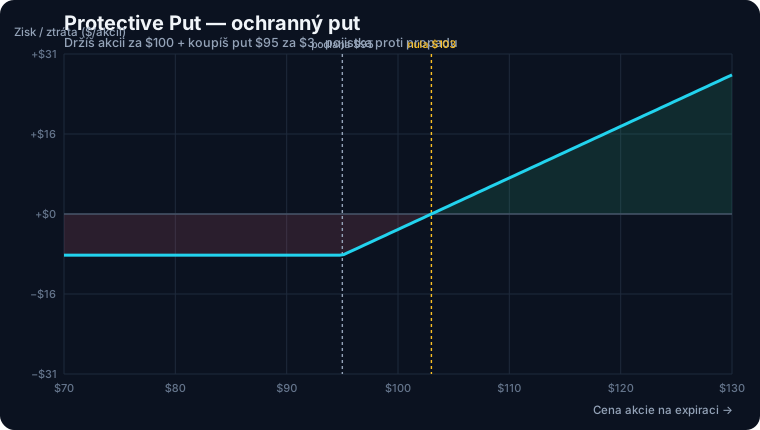
Example: Stock $100 + a $95 put for $3. Your max loss is fixed at $8 per share ($100 − $95 + $3), no matter how far it falls.
Collar
You buy a protective put and sell a higher call that pays for it. The result is "boxed" between a floor and a cap — "zero-cost", but you pay by giving up upside above the cap.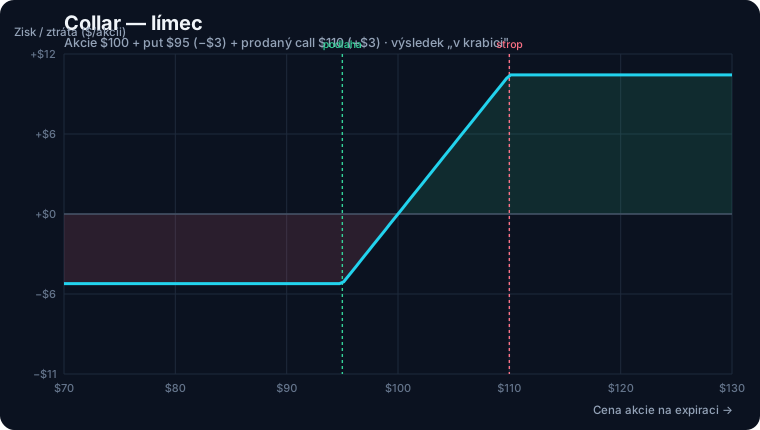
★ Honest note: Academic studies show that continuously hedging with puts tends to lose money long-run, and that simply reducing the position often protects better. Hedging makes most sense for a concentrated position, ahead of a known event (earnings), or when you can't/won't sell (taxes). It is not a tool to switch risk off permanently for free.
10. Probability and expected move
Professionals don't think "win/lose" — they think in probabilities. From option prices (from IV) you can compute the expected move — a ±1σ band the stock lands within roughly 68% of the time by expiry. And the probability of profit (POP) — the theoretical chance the trade finishes positive at expiry.
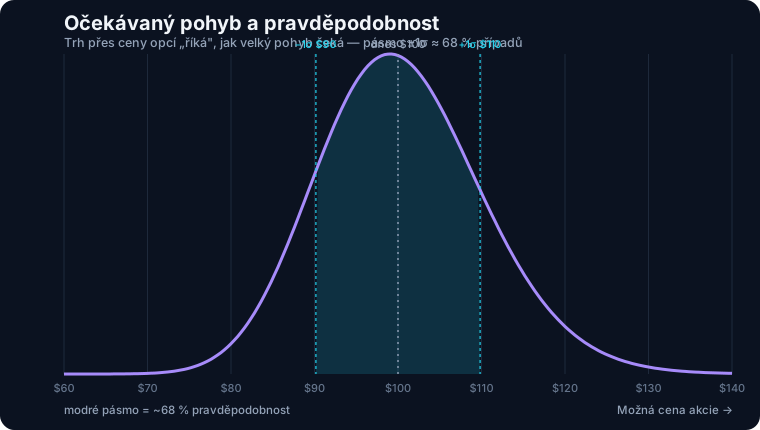
➤ This shifts thinking from "lottery" to risk management. A high POP usually means small profits and rare large losses — and vice versa. Neither POP nor expected move is a forecast or guarantee — just a market-implied estimate.
11. A practical step-by-step process
- Start with a view on the stock (up? flat? down? want to hedge?).
- Pick a structure that expresses that view (see the table below).
- Draw the payoff — where is max profit, max loss, break-even?
- Check probability and expected move — is your target inside, or beyond, the expected move?
- Size the position so you can survive the max loss. Never "all-in".
- Have an exit plan in advance — when you take profit, when you take a loss.
| Your view | Structures that express it |
|---|---|
| Up a lot | Long Call |
| Up moderately | Covered Call, Bull Put Spread |
| Flat | Cash-Secured Put, Covered Call |
| Down | Long Put, Bear Call Spread |
| Want income | Covered Call, Cash-Secured Put (with a tradeoff) |
| Want to hedge stock | Protective Put, Collar |
12. Common mistakes
- Buying too-short-dated options — too little time; theta eats the premium before the stock moves.
- Ignoring IV — buying expensive options before earnings that lose value when volatility deflates, even if the direction is right.
- Position too large — options are leveraged; one sizing mistake can wipe out an account.
- Confusing win rate with return — an 80% win rate with large rare losses can still lose money.
13. How to do it in QMA
Theory is nice, but you learn most by doing. QMA has an interactive Options Hub where you can:
- 🎮 Simulator — drag a slider for the stock price and time, and see live P/L, the payoff curve, POP and the expected move.
- 🧭 Strategy selector — pick your view and QMA shows the structures that express it.
- 🛡️ Hedge your stock — protective put, collar, put-spread collar with examples.
- 📊 Best stocks for options + honest backtests and live strategy tracking.
---
Options data may be delayed (end-of-day) — suitable for swing/positional reasoning, not day-trading. Consult a licensed advisor before any decision.*
Want to know more? Ask the QMA Research Assistant
The Research Assistant knows the whole platform and its data. If the answer is not in the QMA database, it looks it up and explains it in plain language. It is an analytical and educational tool, not investment advice.
Open the Research Assistant →Related articles
Options are not just a “bet on direction.” When used with discipline, they can serve as portfolio insurance or an income source, but they also bring leverage, asymmetry, and risks that must be understood in advance.
10 minWhat the Options Hub is and what each tab does (Guide, Pick a strategy, Strategies, Hedging, Income screener, Paper practice, Candidates, Confluence, Flow & IV). Call/put/strike/IV/POC/theta in plain language + where to start as an absolute beginner.
8 minPart one of the options course: what a call and a put are, strike, expiration, premium, ITM/OTM. On a $100-stock example we show both the leverage and the risk of a 100% loss — in plain language with analogies.
9 minPart two of the course: Delta, Theta, Vega and Gamma explained in plain language with analogies. What each Greek measures, why theta and vega ruin most beginner purchases, and how to read them together.
10 minSee it live: QMA scores 17,000+ stocks for you
Full access to the 5-pillar analysis, smart-money data and the whole-market screener. No commitment, cancel anytime.
QMA Brain – free weekly recap
One email a week with a descriptive recap. Unsubscribe anytime.
7 days of Elite free, no card
The account is free to open and needs no card. For that time the account has full Elite access.
Create a free accountContent created by AI in collaboration with Jaroslav Vojtášek. Not investment advice. The author may hold the stocks mentioned. Investing involves risk of loss.
Operator: Jaroslav Vojtášek, Company ID (IČO) 48783447.