
⚖️QMA vs Finviz: An Honest Comparison (and When a Free Screener Is Enough)
QMA vs Finviz: An Honest Comparison
If you've ever screened stocks for free, you've probably used Finviz. It's fast, clean and genuinely useful. So why look at Quantum Market Analyzer (QMA)? Short answer: it solves a different-sized problem. Here's a fair comparison so you can decide.
In short
- Finviz = an excellent fast, free fundamentals sieve. You connect the dots.
- QMA = more data layers fused into one score, where you can see why.
- Many people use both: Finviz to scan, QMA for one connected read before deciding.
🔰 In plain words (for beginners)
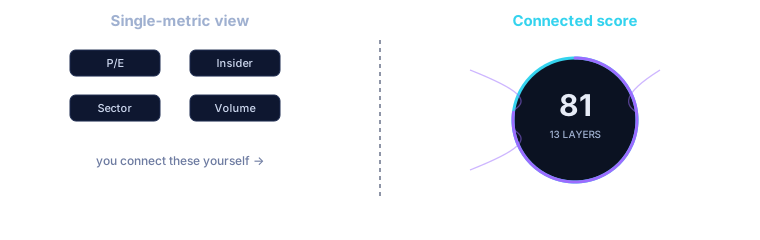
Think of two kitchen tools. Finviz is a sharp knife — fast, simple, free, great for basic work. QMA is a food processor — it does several steps at once and combines them.To chop an onion, a knife is enough. When you want the whole dough mixed and combined, you reach for the processor. With stocks it's the same: for a quick look, Finviz; for the whole connected picture, QMA.
What Finviz does well
Finviz is a strong, lightweight sieve. It quickly filters fundamentals (P/E, company size, sector), shows insider trades (Form 4), and the free tier covers a lot. For a fast first pass, it's hard to beat.Where it stops: it hands you fragments. You get a list and a few tabs of data, but the connecting is on you. It doesn't include congress trades, big-fund 13F positions or seasonality — and there's no single score weighing it all.
How QMA differs
QMA is built around confluence — cross-confirming many layers instead of reading one at a time. It fuses 13 layers (insiders, funds, congress, fundamentals, momentum, seasonality and more) into one composite score you can expand down to data and dates. And it's more beginner-friendly: a tooltip on every term, an academy and ready-made strategies.Layer by layer
| Finviz | QMA | |
|---|---|---|
| Core use | Fast fundamentals sieve | Multi-layer analysis + composite score |
| Data layers | Fundamentals, Form 4 insider | 13 (congress, 13F, seasonality, momentum…) |
| Single composite score | No | Yes |
| Smart money | Insiders only | Insiders + funds + congress |
| Seasonality | No | 150,000+ patterns |
| Beginner support | Minimal | Tooltips + academy + AI coach |
| Free preview | Free screener | Full analysis of 1 stock free |
🎯 For pros
Finviz stays great for a quick scan and a Form 4 glance. QMA's edge is the fused smart-money + seasonality layer and the expandable reasoning (insider weight %, 90-day hit rate, buys-vs-sells) — closer to a terminal workflow at retail cost.💡 What this means for you
You don't have to pick one. For a quick free rummage, Finviz is great. When you want one clear, already-weighed view — and to understand the why — reach for QMA. And you can test it on one stock without paying.Mini-glossary
- Screener — a sieve that picks stocks by criteria.
- Form 4 — the public filing of an insider's trade.
- 13F — a quarterly report of big funds' positions.
- Confluence — agreement across several independent data layers.
Try it in QMA
You'll feel the difference best on one stock. Open a free complete analysis of AAPL (no signup) and look at all 13 layers in one score. Then compare it to the same ticker on a single-metric screener.FAQ
Is QMA a Finviz alternative?
They overlap on screening, but QMA goes further — adding congress, 13F and seasonality, fused into one score. Finviz is lighter and free.Which is better for beginners?
QMA is built for beginners too (tooltips, academy, AI coach). Finviz assumes you know the terms.Can I try QMA without paying?
Yes — a complete analysis of one stock (AAPL) is free, no signup.Past performance ≠ future results. QMA is not a registered investment advisor.
Want to know more? Ask the QMA Research Assistant
The Research Assistant knows the whole platform and its data. If the answer is not in the QMA database, it looks it up and explains it in plain language. It is an analytical and educational tool, not investment advice.
Open the Research Assistant →Related articles
Backtesting looks simple – you run a strategy on historical data and see the results. But most tests suffer from hidden flaws that inflate performance and conceal real risk.
6 minBuy-and-hold, dividends, swing trading, or day trading? Each style demands different amounts of time, nerves, and tax planning. We'll help you find the one that fits your life.
5 minZisk se dá nakreslit, hotovost se skrýt nedá. Podívejte se, proč volný cash flow výnos odhalí kvalitu firmy lépe než P/E — a jak si ho spočítat za dvě minuty.
5 minJedno číslo skóre vypadá elegantně, ale klame. Když ho rozpitváš na pilíře, zjistíš, jestli je firma opravdu skvělá — nebo jen dobrá v jedné věci a slabá ve třech.
6 minSee it live: QMA scores 17,000+ stocks for you
Full access to the 5-pillar analysis, smart-money data and the whole-market screener. No commitment, cancel anytime.
Scores of the stocks mentioned
- AAPL 44.3 as of 2026-10-24
The 0–100 figure is a descriptive QMA composite score. Score methodology
QMA Brain – free weekly recap
One email a week with a descriptive recap. Unsubscribe anytime.
7 days of Elite free, no card
The account is free to open and needs no card. For that time the account has full Elite access.
Create a free accountContent created by AI in collaboration with Jaroslav Vojtášek. Not investment advice. The author may hold the stocks mentioned. Investing involves risk of loss.
Operator: Jaroslav Vojtášek, Company ID (IČO) 48783447.