
🔎Best Stock Screener 2026: How to Pick Strong Stocks From Thousands
Best Stock Screener 2026: How to Pick Strong Stocks From Thousands
The U.S. market has thousands of stocks. Nobody reviews them by hand. A stock screener filters that giant list for you and returns the handful worth your attention. This guide shows you how to tell a good screener from a box of filters — and gives you a practical method you can use today, even as a complete beginner.
In short
- A screener is a sieve for the whole market. You set conditions, it returns matches.
- Most screeners filter one or two metrics (price, P/E) — you connect the rest yourself.
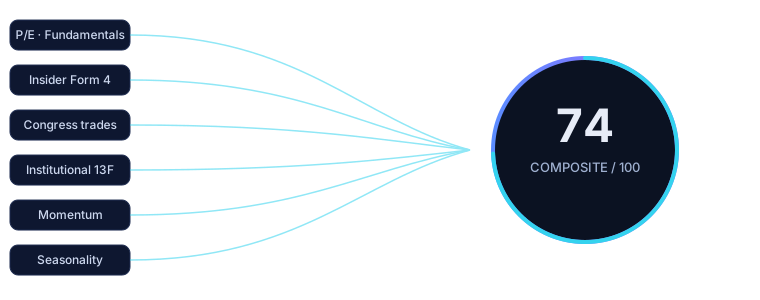
- The edge isn't more data, it's data that's connected into one score.
- Below: a 5-step method from thousands of stocks to a short list.
🔰 In plain words (for beginners)
Imagine house-hunting on a property site. If it showed all those thousands of listings at once, you'd give up. So you set filters: price, rooms, location. It returns 12 homes — and you only look at those.A stock screener does exactly this, with stocks instead of homes. You tell it what matters ("big stable companies whose own executives are buying"), and it hands you a short list. Without it, you're hunting a needle in a haystack.
What a screener does (and what "P/E" means)
A screener works off data and rules. You set conditions, it returns matches. It answers "what should I even look at?"Common filters:
- Market cap — how big the company is (share price × number of shares).
- P/E (price/earnings) — what you pay for $1 of the company's yearly profit. Low = "cheap", high = "expensive" (but cheap isn't always good — see below).
- Momentum — whether the stock has been rising or falling lately.
Why one smart score beats ten filters
Say a screener flags a stock as "cheap" on P/E. On its own that means almost nothing. Cheap because it's undervalued (opportunity) — or because the business is shrinking (a trap)?
To find out, you'd normally open a second tool for insiders, a third for big funds, a fourth for momentum, a fifth for seasonality. By the time you've stitched it together, the signal is stale. The real problem isn't missing data — it's the missing connection between it.
A good 2026 screener doesn't just show the data; it fuses it into one score and tells you why.
What to look for
| Criterion | Weak screener | What you want |
|---|---|---|
| Data breadth | Price + basic ratios | + insiders, funds, congress, seasonality |
| Output | A list to filter | One score per stock |
| Reasoning | Black box | Expand it and see why |
| Freshness | Weekly | Daily, real dates |
| Beginner support | None | Tooltip on every term |
🎯 For pros
A composite score doesn't replace your process — it compresses the first hour of it. Use it to rank the universe, then drill into the layers that fit your thesis: expand insider weight %, the insider's 90-day hit rate, freshness of 13F adds. The win is fewer tabs and a consistent, cross-confirmed starting set every day.Step by step
- Start with the score, not the chart. Rank the universe by composite score — this kills 90% of the noise.
- Demand confluence. Keep only names where at least 3 independent layers agree.
- Check smart money. Open-market insider buys and fresh fund adds outweigh any single metric.
- Sanity-check timing/seasonality. Strong historical window, or fighting the calendar?
- Read the "why". If you can't explain the score in a sentence, skip it.
💡 What this means for you
You don't need to be a pro or burn hours across ten tools. A one-score screener gives you a starting list in minutes, so you decide on data, not gut feel. The better it connects the data, the fewer mistakes you make.Mini-glossary
- Screener — a sieve that picks stocks from the whole market by your rules.
- P/E — what you pay for $1 of yearly profit.
- Insider — a company executive; their trades are reported and public.
- Confluence — agreement of several independent signals.
- Composite score — one number (0–100) fusing all data layers.
Try it in QMA
QMA fuses 13 layers of data — insiders, funds, congress trades, fundamentals, momentum, seasonality and more — across thousands of stocks into one composite score you can expand to see why. See it on one stock: open a free complete analysis of AAPL, no signup.FAQ
Is a screener the same as investment advice?
No. It only shows data and scores. It doesn't say buy/sell and guarantees nothing.Screener vs scanner?
A screener filters by criteria (what to look at). A scanner tracks live price/volume (when to act). Beginners get more from a screener.How many stocks does QMA cover?
Thousands of stocks, scored daily, plus thousands of ETFs.Can I try it free?
Yes — a complete analysis of one stock (AAPL) is free, no signup.Past performance ≠ future results. QMA is not a registered investment advisor.
Want to know more? Ask the QMA Research Assistant
The Research Assistant knows the whole platform and its data. If the answer is not in the QMA database, it looks it up and explains it in plain language. It is an analytical and educational tool, not investment advice.
Open the Research Assistant →Related articles
Backtesting looks simple – you run a strategy on historical data and see the results. But most tests suffer from hidden flaws that inflate performance and conceal real risk.
6 minBuy-and-hold, dividends, swing trading, or day trading? Each style demands different amounts of time, nerves, and tax planning. We'll help you find the one that fits your life.
5 minZisk se dá nakreslit, hotovost se skrýt nedá. Podívejte se, proč volný cash flow výnos odhalí kvalitu firmy lépe než P/E — a jak si ho spočítat za dvě minuty.
5 minJedno číslo skóre vypadá elegantně, ale klame. Když ho rozpitváš na pilíře, zjistíš, jestli je firma opravdu skvělá — nebo jen dobrá v jedné věci a slabá ve třech.
6 minSee it live: QMA scores 17,000+ stocks for you
Full access to the 5-pillar analysis, smart-money data and the whole-market screener. No commitment, cancel anytime.
Scores of the stocks mentioned
- AAPL 44.3 as of 2026-10-24
The 0–100 figure is a descriptive QMA composite score. Score methodology
QMA Brain – free weekly recap
One email a week with a descriptive recap. Unsubscribe anytime.
7 days of Elite free, no card
The account is free to open and needs no card. For that time the account has full Elite access.
Create a free accountContent created by AI in collaboration with Jaroslav Vojtášek. Not investment advice. The author may hold the stocks mentioned. Investing involves risk of loss.
Operator: Jaroslav Vojtášek, Company ID (IČO) 48783447.